Health Scoring Methodology
Prism Customer Success Handbook — Section 1.6
⚠️ Handbook ahead of software. This page documents the target four-category model. The running CSP still uses the previous five-category model (including a "Commercial Risk" category) with different weights. The migration is scoped in
BUILD_BACKLOG.mdfor the Prism v2 push. When walking through the live app, this gap is deliberate and explainable — the handbook is the target model, the app is on the prior version.
What health is for
Health is a decision-support system, not a report card. Its only job is to tell the CSM where to spend attention today. A category that can't change what the CSM does doesn't belong in the model.
Two design rules govern everything below:
- Believable data only. No component may depend on data Prism couldn't reliably and plausibly collect from its own systems. This rule killed two earlier candidates — see Rejected components.
- No self-reference. Health cannot be composed from signals that health itself generates, or the score quietly counts itself.
The four categories
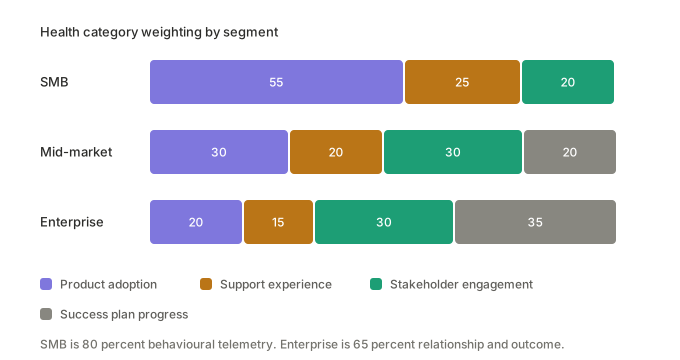
Each category scores 0–100. The composite is category scores × segment weights.
Product Adoption
Are they actually using Prism, and did they ever reach value?
Two components, 50/50:
- Milestone progress — how far through the four standardized adoption milestones the account has come (see 1.7 Success Plans). A stock measure: did they ever get there?
- Usage recency & consistency — scheduled reports delivering on cadence, plus logins and dashboard views in the last 30 days. A flow measure: are they still doing it?
Why both: milestones alone would let an account coast forever on a line it crossed six months ago. Usage alone would miss that an account is busy inside Studio but has never put a single client on the Portal. The stock/flow pairing catches the account that succeeded once and quietly stalled — the single most common adoption failure for this product.
Support Experience
Is support hurting this relationship?
Volume is deliberately not scored. Ticket count is ambiguous in both directions — high volume can mean an engaged account asking lots of easy questions or an account in dysfunction; low volume can mean everything works or nobody's using it. A signal ambiguous in both directions carries no information. Engagement shows up in Product Adoption, where it belongs.
Three components, all ratios or averages so high- and low-volume accounts are judged on the same footing:
- Severity mix (proportional) — what share of their tickets are serious vs. routine
- Resolution time vs. target — are they waiting too long
- Reopen / escalation rate — did we actually fix it the first time
Severity tiers:
| Tier | Definition |
|---|---|
| P1 — Critical | Client-facing breakage. Scheduled reports failed to send, Portal is down, a data source stopped syncing and end clients are seeing stale numbers. Their customers see something wrong. |
| P2 — High | Significant but internal. A dashboard won't build correctly, an integration is dropping fields, a report renders wrong before it goes out. |
| P3 — Normal | Bugs and unexpected behavior with available workarounds. |
| P4 — Low | How-do-I questions, feature requests, cosmetic issues. |
Directional weighting: P1s pull the score down hard, P2s moderately, P3s slightly, P4s not at all — then normalized by ticket count.
Penalty-only from a neutral baseline. A clean account sits at a neutral baseline (~75–80), not a perfect 100. Silence earns nothing. This prevents the category from lying: without it, a dead account with zero tickets would score perfectly on support.
90-day rolling window. Incidents age out. An account with four P1s last month is in trouble now; an account with four P1s eight months ago that's been clean since has recovered, and the score must be able to show that.
Expect this category to be flat for most accounts most of the time. That's a feature — when it moves, it means something.
Stakeholder Engagement
Is there a real, durable relationship here, or a single thread about to snap?
Four components:
- Contact recency — when did we last have a genuine two-way interaction (meeting or call, not a broadcast email)
- Responsiveness — do outreach attempts get replies, or are we talking into a void? Catches the account that looks "recently contacted" only because the CSM keeps emailing someone who never answers.
- Multi-threading (segment-relative) — how many distinct contacts we have live relationships with. Judged against segment expectation, not an absolute number: two contacts at an SMB may be the whole company; two contacts at an Enterprise account is dangerously thin.
- Champion status — is there an identified champion, and are they still there?
Each catches a distinct failure mode: gone quiet, ignoring us, one point of failure, lost our advocate.
Success Plan Progress
Mid-Market and Enterprise only — this category does not apply to SMB.
Are the outcomes the customer told us they wanted actually landing?
- Goal completion rate — of the goals in the plan, what share are complete vs. overdue
- Plan currency — when was the plan last reviewed with the customer? A plan untouched for six months is an artifact, not progress.
- Goal timeliness — are outcomes landing near their target dates, or slipping?
Why it's gated to MM/Enterprise: SMB accounts follow a standardized success path defined by the adoption milestones — the same definition of success applied uniformly, not authored per customer. There is no bespoke plan to score, and scoring the milestones here would double-count Product Adoption. Individually authored success plans begin at Mid-Market, where deal complexity and stakeholder count justify custom outcomes.
On gameability: the CSM both sets these goals and marks their progress, which is a real weakness in any success-plan metric. Plan currency and slippage are the guards — both penalize neglect rather than rewarding optimistic self-scoring, and neither improves by simply declaring success.
Segment weights
| Category | SMB | Mid-Market | Enterprise |
|---|---|---|---|
| Product Adoption | 55% | 30% | 20% |
| Support Experience | 25% | 20% | 15% |
| Stakeholder Engagement | 20% | 30% | 30% |
| Success Plan Progress | — | 20% | 35% |
The one-sentence rationale: SMB is 80% behavioral telemetry, because tech-touch coverage means nobody is having regular conversations and the signals we can collect without talking to anyone are the only honest ones. Enterprise is 65% relationship-and-outcome, because when you have a named relationship anyway, what people say and whether outcomes land predicts renewal better than usage counts do. Mid-Market is a genuine transition zone, not a rounding of either neighbor.
Bands
| Band | Range |
|---|---|
| Healthy | 80–100 |
| Stable | 60–79 |
| Watch List | 40–59 |
| At Risk | 20–39 |
| Critical | 0–19 |
Note the terminology collision, resolved in 1.3 Customer Data Model: "At Risk" the health band (20–39) is not the same thing as At-Risk the lifecycle state, and neither is the Renewal Risk playbook. Band is a score range; state is a condition; playbook is a response.
Lifecycle state transitions
Health scoring exists to drive state, and state drives playbooks. The rule:
An account enters At-Risk when either condition is true:
- composite health falls below Stable (under 60), or
- any risk-type playbook is active (Risk Level ≥ Elevated)
An account returns to Healthy only when both clear: composite at Stable or above and no active risk-type playbooks.
The asymmetry is deliberate. Entering At-Risk is easy — either signal alone suffices, because a false positive costs an unnecessary check-in while a false negative costs an account. Exiting is hard — both must clear, because a number ticking up while the underlying playbook is still open is not recovery.
Why not health band alone: the composite is an average, so a catastrophic single category can hide behind three healthy ones. Brightpath is the canonical case — composite 63 (Stable) while Product Adoption sits at 31. Under a band-only rule that account reads Healthy, which is plainly wrong. The playbook condition catches it: Low Adoption triggers on Product Adoption below 40, so Brightpath goes At-Risk on the second condition despite an unremarkable composite.
Risk Level — a separate signal, not a health input
Health Band answers "how is this account doing?" — a continuous, outcome-based measure. Risk Level answers a different question: "how many active risk-type playbooks are compounding right now, and has a CSM escalated one?"
These are genuinely different. An account can have a mediocre-but-stable health band with nothing actively wrong, or a decent health band with two playbooks compounding. Apex Labs is the case in point: Health Decline and Low Adoption both active simultaneously → Risk Level Compounding, a situation the composite alone cannot express.
| Tier | Condition |
|---|---|
| Stable | 0 active risk-type playbooks |
| Elevated | exactly 1, not escalated |
| Compounding | 2+, not escalated |
| Critical | any active risk-type playbook is escalated |
Escalation is a CSM's explicit judgment call and always overrides the computed tier. Expansion Opportunity is excluded — a positive signal never counts toward risk.
Rejected components
Documented because the reasoning matters more than the conclusion.
- Commercial Risk (removed as a category). Nothing believable and non-circular was left to compose it from: no billing data (out of scope), uniform annual contracts (no term variance), no expansion/contraction history (deliberately not modeled). The only remaining inputs — escalations and risk-playbook counts — are what Risk Level already measures and what health partly triggers, so including them would have health counting itself. Its weight redistributed across the remaining categories.
- Adoption breadth (share of the customer's client book on Prism). Needs a denominator — how many clients the firm actually has — that lives in the customer's business, not in Prism. Self-reporting goes stale immediately and manual entry wouldn't hold across an SMB-heavy book. Dropped rather than approximated.
- Ticket CSAT. Only collected on the fraction of tickets someone bothers to respond to; sparse-coverage signals get noisy fast at SMB volume.
- Playbook-type weighting within Risk Level (e.g. Renewal Risk counting more than Low Adoption) — arbitrary without real usage data to justify specific weights. A v2 candidate if the count-based model proves insufficient.
Known limits
- Health snapshots are seeded weekly rather than recalculated live when new data arrives; live recalculation is a v2 item.
- Signals are stored as computed values on snapshots, not as raw event tables — meaning the component-level definitions above describe the target model, not currently queryable raw data.
- Weights are hardcoded rather than configurable.
Related pages
- 1.2 CS Operating Model — segmentation this weighting follows from
- 1.3 Customer Data Model — resolves "risk" terminology across band/state/playbook
- 1.4 Customer Lifecycle — the states these transition rules drive
- 1.7 Success Plans — the milestones and plan structure scored above
- 1.8 Metrics Library — formal metric definitions
- 3.1 Health Decline, 3.3 Low Adoption — playbooks triggered by these scores